PERFORMANCE / MEASURE FIRST

Find the slow path before changing the architecture.

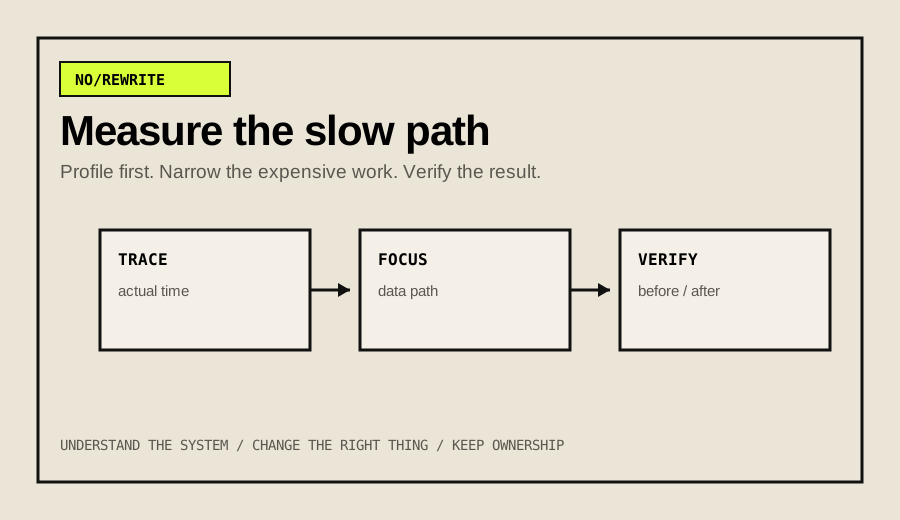
Performance work starts with measurements: request timing, query traces, EXPLAIN ANALYZE, workload shape and the actual data path users are waiting on.

Performance optimization diagram
METHOD / OBSERVE THE WHOLE PATH

The slow query is sometimes only the symptom.

We look at the full request: query count, execution plans, broad model hydration, repeated calculations, database views, cache misses, external calls, serialization and work that should have happened asynchronously.

  • Request and endpoint timing
  • MySQL EXPLAIN / EXPLAIN ANALYZE
  • Eloquent relationship and N+1 review
  • View-heavy and aggregate retrieval paths
  • Indexes, selectivity and row multiplication
  • Cache and queue placement
  • Before/after verification using the same workload
DIAGNOSTIC / QUESTIONS

Performance work should explain where the time went.

If the result is only “we added Redis” or “we upgraded the server,” the root cause may still be sitting underneath the workaround.

01 / DATABASE

How many rows are touched?

Use actual plans to see scans, joins, temporary tables, deduplication and row multiplication rather than guessing from SQL text.

02 / ORM

How much is hydrated?

A request can be slow because the application asks for far more relationships or columns than the screen ever consumes.

03 / REPEAT WORK

What is calculated twice?

Counters, totals, formatting and derived fields can accidentally repeat expensive work across the same request.

04 / NETWORK

What waits on another system?

External APIs, webhooks and synchronous service calls can dominate response time even when local queries look healthy.

05 / CACHE

What is safe to reuse?

Caching is useful when invalidation and freshness are understood; it is not a substitute for fixing a pathological access path.

06 / VERIFY

Did the user-visible path improve?

Re-run the same workload and verify output, filters, counters and side effects instead of celebrating one isolated query benchmark.

OUTPUT / WHAT YOU RECEIVE

A performance engagement should leave more than a faster screenshot.

The useful output is a repeatable explanation of the bottleneck, the change that addressed it and the evidence that the same user-visible path improved without breaking its contract.

01 / BASELINE

Measured starting point.

Record the slow endpoint or workflow, representative timing, query behavior and the conditions under which the problem appears.

02 / EVIDENCE

Root-cause trail.

Capture the relevant query plans, application data path, ORM behavior, external waits or repeated work that explain where the time is actually spent.

03 / CHANGE

Smallest justified fix.

Prefer the narrowest change that removes the demonstrated bottleneck while preserving filtering, counters, permissions, side effects and operational behavior.

04 / VERIFY

Before/after proof.

Re-run the same workflow, compare timings and confirm the business result still matches what users and downstream code expect.

BOUNDARY / WHAT PERFORMANCE WORK IS NOT

No infrastructure shopping list before the bottleneck is understood.

More CPU, Redis, a new queue, a different database or a framework upgrade can all be valid answers. They are not default answers. If a request hydrates thousands of unnecessary models or a join multiplies rows before deduplication, changing infrastructure can simply make an avoidable path more expensive to operate.

Where the evidence points to capacity rather than code, that is documented explicitly so the recommendation is still tied to an observed constraint.